
Understanding complex space:
How connectivity mapping brought clarity to early design decisions
In the early stages of a major event design at the Mandalay Bay Convention Center, I used Space Syntax analysis and DepthMapX to visualize how spatial connectivity shapes movement patterns in the venue.
The goal? Turn complexity of scale into strategic clarity and identify where design investment should be focused.
Scale, sprawl, and spatial ordering
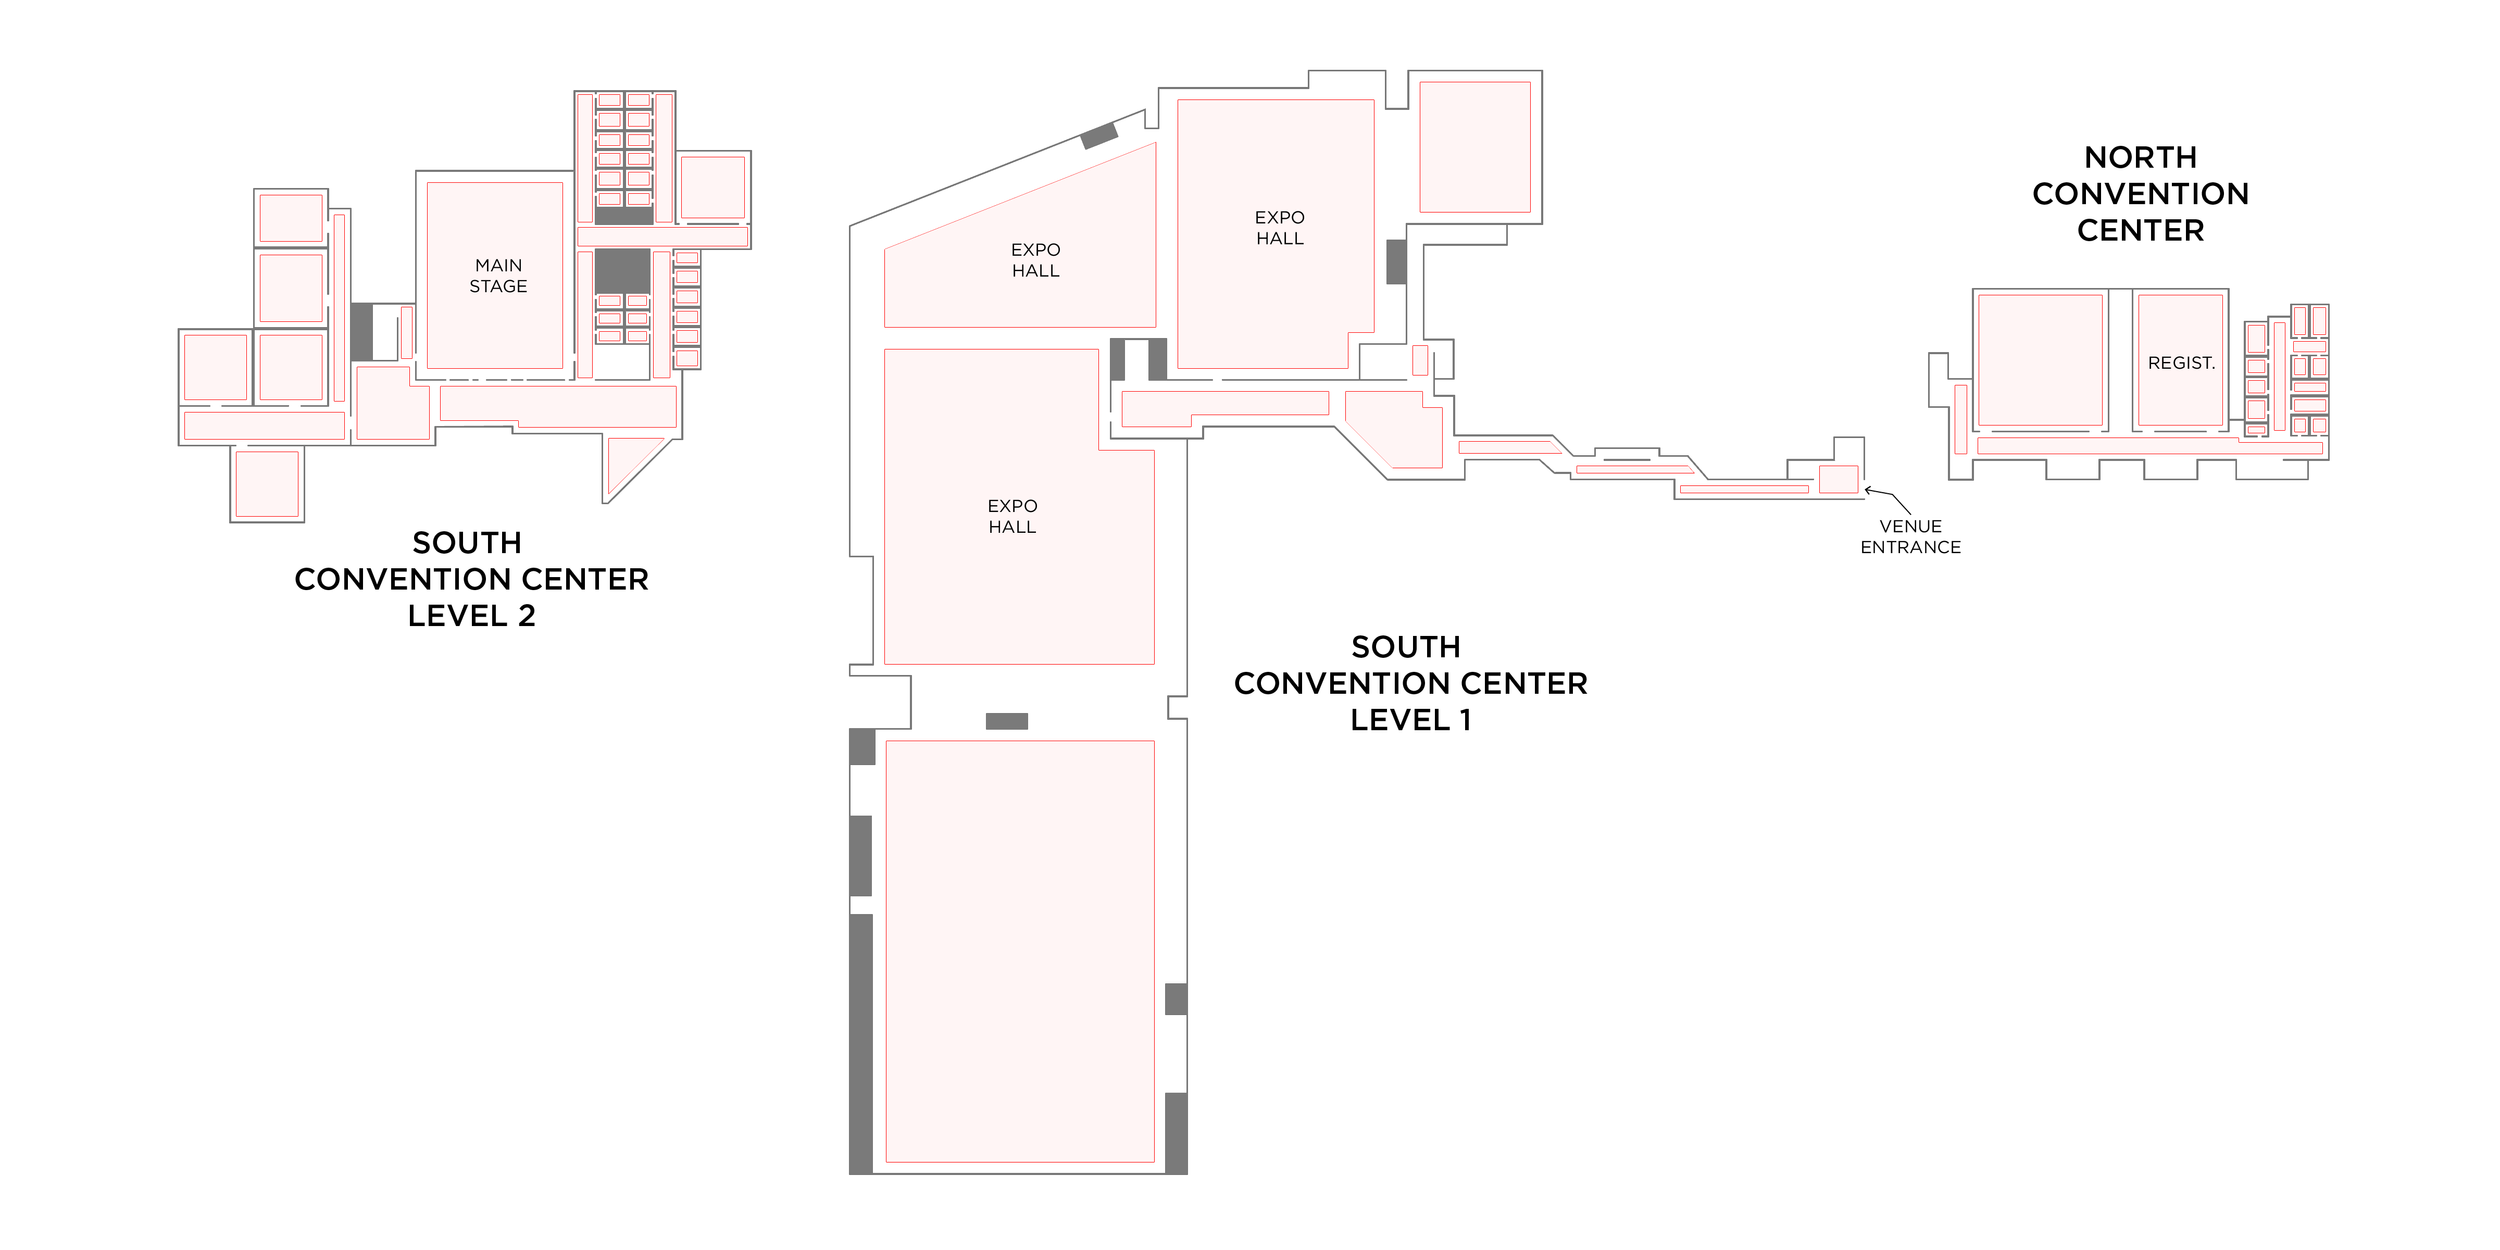
The Mandalay Bay Convention Center is a sprawling, three-story venue with dozens of loosely connected rooms, lobbies, and corridors—and nearly a million square feet of open event space. While the project brief identified key destinations like the expo hall and main stages, it lacked clarity on how the overall venue would come to life.
To make sense of the scale, I began by dividing the venue into discrete spatial units. Each unit, defined in Space Syntax as a “convex space,” represents the largest area in which any two points can be connected by a straight line. These spaces are determined by architectural edges, sharp turns, and visual obstructions.
With the convex spaces mapped, the venue became a legible spatial network that could be analyzed for connectivity, attendee flow, and strategic impact.

Measuring entropy with DepthMapX
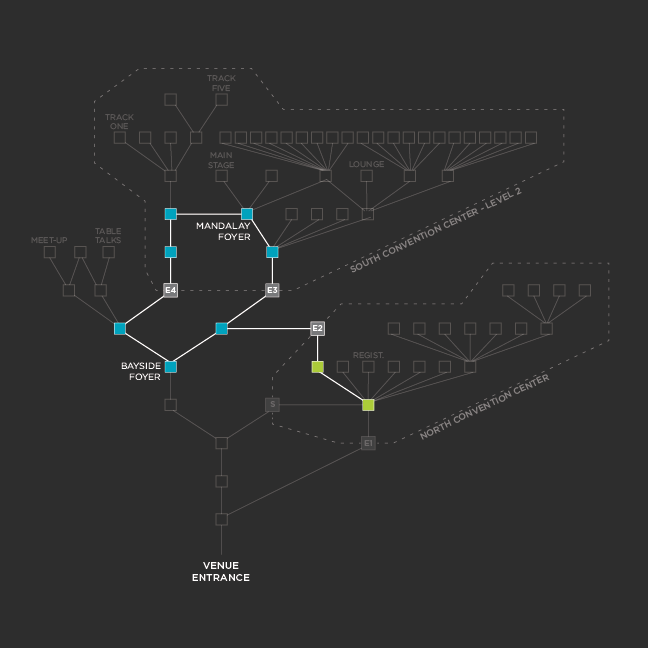
To analyze circulation patterns, axial pathways are used to evaluate the integration of each convex space, resulting in a connectivity map that visualizes the venue’s spatial depth. For each space in the layout, an entropy value is then calculated by determining the number of steps required to reach that space in the network. This value reflects not just distance, but also the distribution and asymmetry of the overall layout.
In short: high-entropy spaces are harder to reach and less integrated while low-entropy spaces serve as natural pathways or gathering places.


Mapping attendee behavior
Using the connectivity map, I modeled a series of user journeys through the venue. Each scenarios was created to reflect a cross-section of attendee types and personality: early arrivals, sponsors, speakers, business leaders, and general public.
By visualizing movement as a sequence of node connections, the map reveals how a complex network of spaces form overall circulation patterns. With highly integrated spaces appearing regularly in attendee journeys and low integration zones rarely occupied, these patterns reinforced my earlier entropy analysis.
Design where it counts
The insights from the connectivity map, entropy analysis, and user journey scenarios all pointed to the same conclusion: a few key areas would carry the weight of the attendee experience. Rather than spreading effort thin across the venue, I used this data to focus design attention and my client’s budget on the spaces that mattered most.
In sprawling, high-stakes venues, design intuition isn’t enough. This analysis proved that spatial logic and real-world behavior modeling can guide smarter decisions early in the design process.